Loading...


Call us on +49 40 86 62 77 88 or email us at info@opture.com

Order your free personal software presentation or our detailed product brochures now.

Risk Management Process

Risk management process

All Opture risk management software solutions include the complete risk management process. As part of risk identification, the risks, opportunities and measures are identified and evaluated on the basis of a risk catalog. The risk analysis, followed by the risk assessment, enables the risk manager or the risk owner to realize an effective risk steering. After defining the risk mitigation measures, the risk results are graphically presented and documented in the risk report. Risk monitoring controls the development of individual risks and risk exposures.


Process steps

  • Risk identification
  • Risk assessment
  • Risk analysis
  • Risk steering
  • Risk reporting
  • Risk monitoring

Risk Identification

The risks, opportunities and measures can be identified in the Opture risk management software using an individuelly configurable risk catalog. Industry-specific risk catalogs are already available as a standard template in the software. All risk catalogs are freely configurable. Alternatively, you can choose between a standard catalogues, industry specific best practise risk catalog or your individual and company specific risk catalog. The contents and structures of the standard catalog and the individual risk catalogs can be changed by the user (-> deleted, edited, added, moved, renamed, etc.) at any time.

Risk Assessment

The risks, opportunities and measures are assessed quantitatively and qualitatively in the Opture risk management software. The quantitative assessment is made by specifying the probability of occurrence and the financial loss or deviation from plan figures (optional for best, normal and worst case scenarios) or, if desired, by specifying distribution functions. We have developed a so-called "risk profiling" concept for the increase of data input quality, which can also be stored in the software. In addition to a significant improvement in data quality, these methods also contribute to increasing customer acceptance (-> for risk owners and management).

For the calculation of risk figures (-> VaR, RAROC, EaR, RaC, etc.) by using the Monte Carlo simulation, it is NOT necessary in Opture to specify complex distribution functions per individual risk as part of the risk assessment. The specification of distribution functions is very imprecise (-> very high estimation and model errors) and is extremely impractical and not comprehensible/understandable for the risk owners.

Risk Analysis

Risk consolidation and aggregation, as well as risk analysis, can be carried out according to any selection criteria, parameters and structures. The analyses and consolidations can, for example, can be executed over all hierarchical levels of the company (in total or per hierarchy level or per subsidiary) or over freely defined risk portfolios, such as, for example, by the selection of any number of risk categories and/or risk owners and/or business units and/or regions, etc.

Opture risk management software calculates all risk key figures starting from a gross/net average value (-> Opture Basic Version) to KRI (Key Risk Indicators) such as Sigma, Sensitivities, VaR, cond. VaR, EaR, CFaR, RAROC, RaC, Median, quantiles, probability distributions, etc. (-> Opture Advanced and Opture Expert versions).

For risk aggregation, Opture uses an integrated high-performance Monte Carlo simulator (-> no separate or Excel-based third-party tool) with which any (!) number of risks under consideration of all (!) correlations from +1 to -1 can be calculated with the highest precision. Opture calculates the correlation matrix automatically.

As the first software provider, Opture has been calculating a complete risk-adjusted profit and loss statement with all target figures and key risk figures for over 10 years (-> Opture Simulation-based Planning).

Risk Steering

Efficient risk management takes place both at the individual risk level and at the consolidated level (-> diversification effects). Often, the top 10 risks in a risk map are not sufficient for sustainable and value-oriented risk management, since both market risks (empirical value often "0" -> normally distributed), such as, for example, exchange rate or raw material price fluctuations, and correlated risks that occur at the same time (-> cause of the crisis 2008/2009) remain unconsidered.

For optimal risk management, it is imperative to analyse whether the measures already initiated or still to be implemented are also efficient. It is not infrequently observed that the measure costs are as high as the risk values or mitigations effects. For this it is necessary in addition to the mitigation effects (-> risk mitigating measures), to evaluate also the mitigation costs (-> cost of measures) and take these into account to the calculations.

Some of our customers already use so-called "sensitivities" as a key indicator for risk-adjusted and sustainable corporate management. The sensitivities indicate how stable the planning is and/or how robust the company is against market fluctuations. This statement is relevant from the point of view of controlling, since more and more market factors (-> currencies, raw material prices, interest rates, economic activity, etc.) simultaneously affect a company and cause deviations from the plan.

Risk Reporting

The Opture risk management software contains a standard risk report in text and presentation form, which can be configured by the users as needed. It is also possible for users to upload individual report templates into the software.

All individual risk reports are updated with the current calculation results at the push of a button. This places users in the comfortable situation where they can calculate, document and print out up-to-date risk reports at any time without any effort.

Risk Monitoring

Risk controlling monitors both the development of individual risks and consolidated "risk exposures" as well as the progress of the implementation of defined control measures at company and/or operating level.

Risk Aggregation

Risk aggregation

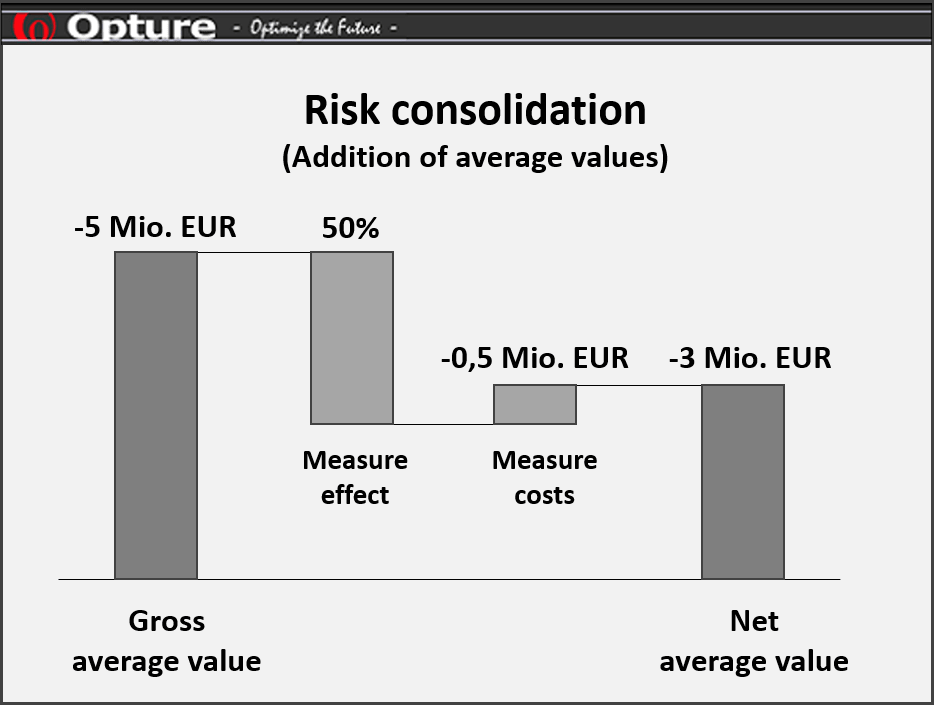
The risk consolidation describes the aggregation of risks based on expected values (gross and net). The addition of risk average values is allowed to calculate the expected risk exposure. Often, the term "risk consolidation" is used interchangeably with the term "risk aggregation". However, risk aggregation differs from risk consolidation in that aggregation takes into account the correlations (-> interactions) between risks through risk simulation procedures. With risk aggregation, primarily risk key figures such as VaR, CFaR, EaR, RAROC, RAC, etc. are calculated. Risk average values will be calculated as part of the risk management software Opture ERM Basic (-> risk consolidation) and risk figures as results using Monte Carlo simulations are calculated by the risk management software Opture ERM Advanced and Expert (-> risk aggregation).

Example of risk consolidating (see picture): A company has two business units (BU), each with purchase and sales departments. The risks are presented in the form of EBIT volatilities with an amount of EUR 50 million per year. What is the consolidated risk of the company in terms of Holding EBIT volatility?

Risk consolidation: With the intuitive approach, the risks average values would be added, with a profit of € 100 million for each business unit and € 200 million for the whole enterprise. This would the correct result for the specific case that all risks are fully (100%) positively correlated. However, this case is not the normal case because the sales and purchase departments and / or business units always contain some dependencies / interdependencies (e.g., correlations or anti-correlations). In practice there are diversification effects between purchase and sales and / or different business units. The task of risk controlling and risk management consists the quantification of these effects and the calculation of correctly consolidated risk figures.

Risk aggregation: For risk aggregation it is necessary to quantify the correlations between purchase and sales as well as the business units. Insofar as the risks of purchase and sales due to anti-correlated effects, e.g. in terms of exchange rate effects, the risk effects are eliminated to a certain percentage, with large diversification effects at the business entity level (the risks of the purchase and sales department in the graph are correlated with -95.5% and -82%). If two business units operate independently of each other and there are no common factors, then the assumption is that the correlations are negligible (e.g. correlations=0%, as assumed in the graph). Furthermore the assumption is that diversification effects exist even without given correlations. The result shows that correct aggregation, with consideration of correlations, can lead to diversification effects that reduce the overall risk to 1/6 of the intuitive value with conventional risk addition.

Key Risk Figures

  • Gross-/Net Average Values
  • Value at Risk (VaR)
  • EaR, CFaR, cond. VaR, exp. Loss
  • RAC, RAROC, RORAC
  • Probability Distribution
  • Sensitivities

Success Factors & Requirements

Risk management requirements

In general, the key success factors for the successful institutionalization of risk management systems in industrial companies are (1.) efficient communication of this topic (-> reasons, benefits, tasks, content) and (2.) an endorsement and active support of this topic by the top management ( -> support, data check, control).

To ensure acceptance of risk management software among employees and risk owners, at least the following system requirements should be met. Also request our detailed catalog of requirements catalog of requirements or we offer you a free workshop in which we develop an individual plan of action with you.

Minimum requirements for a professional risk management software are:
- intuitively operateable (-> employee acceptance)
- flexibly modifiable (-> mapping of all organizational structures))
- industry-specific configurable (-> industry-specific solutions)
- easy to administer (-> high flexibility)
- modular extendable (-> sustainability)
- easy to implement (-> short implementation time)

Key Success Factors

  • Risk data quality
  • Risk data assessment proccess
  • Risk management software
  • Support of top management
  • Communikation during Implement.
  • Experience of risk managers